Greyhound Results by Track — Stadium-by-Stadium Breakdown
Best Greyhound Betting Sites – Bet on Greyhounds in 2026
Loading...
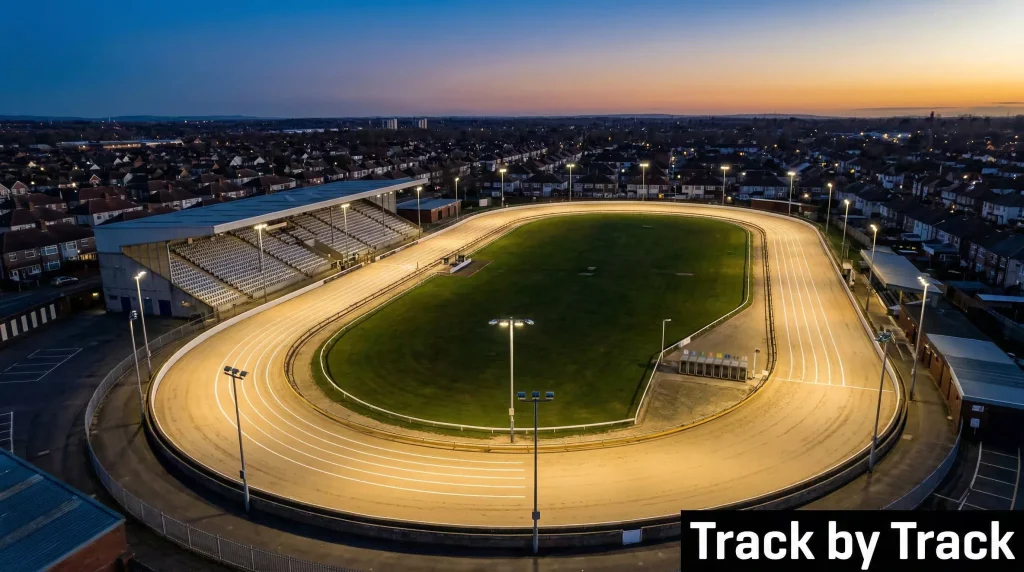
There are 18 licensed GBGB stadiums currently operating across Britain — all of them in England except one in Wales, and none at all in Scotland. That number is not trivia. It defines the boundaries of the entire sport’s data output. Every official greyhound result produced in the United Kingdom comes from one of these 18 venues, and each venue has its own circuit dimensions, surface characteristics, race scheduling and competitive profile. Two dogs posting the same finishing time at two different tracks may have run very different races. Understanding the track is how you tell those races apart.
This page breaks down greyhound results track by track. Not just which venues exist and where they are — though that matters — but what each track’s physical characteristics mean for the results it produces. Bend radii, straight lengths, surface types and standard distances all shape the data in ways that a single results table never captures. A 29.50 at Towcester and a 29.50 at Romford are not equivalent performances, and the gap between them only makes sense if you understand the tracks that produced them.
Below, you will find the full list of licensed venues, a guide to comparing track profiles, a look at how circuit geometry influences finishing positions, and the favourite win rates that vary — sometimes dramatically — from one stadium to the next. Every result reads differently once you know the track it came from.
The 18 Licensed GBGB Tracks
The 18 stadiums currently holding GBGB licences are spread across England and Wales, though “spread” is generous — the distribution skews heavily towards the Midlands, the South East and Greater London. Here is the full list as of 2026: Central Park (Sittingbourne), Doncaster, Dunstall Park (Wolverhampton), Hall Green (Birmingham), Harlow, Hove, Kinsley, Monmore Green (Wolverhampton), Newcastle (Brough Park), Nottingham (Colwick Park), Oxford, Poole, Romford, Sheffield (Owlerton), Sunderland, Towcester and Valley Stadium (Ystrad Mynach, Wales). Dunstall Park, the newest track, opened in September 2025 within the Wolverhampton horse racecourse grounds, replacing the historic Perry Barr Stadium whose lease expired. Oxford, which reopened in 2022 after a decade-long closure, rounds out the circuit.
That list represents a significant contraction from the sport’s mid-twentieth-century peak, when 77 licensed tracks were running simultaneously alongside over two hundred independent venues. The closures have not been uniform. London alone once had more than a dozen tracks — White City, Wimbledon, Walthamstow, Catford, Hackney, Harringay and others — and now the nearest licensed venue to central London is Romford, in the eastern suburbs. The Midlands has held its ground more successfully, with Hall Green, Monmore and Dunstall Park all still operating within a relatively short radius of each other.
Regionally, the distribution creates natural clusters. The South East has Romford, Harlow, Central Park and Oxford, all within reasonable driving distance of each other — though the closure of Crayford in January 2025 removed one of the busiest venues from the cluster. The south coast is served by Hove and Poole. The Midlands cluster — Hall Green, Monmore, Dunstall Park — is the densest concentration, supplemented by Towcester to the south and Nottingham to the east. Further north, Sheffield, Doncaster, Kinsley and Newcastle are more widely spaced, while Sunderland covers the far north-east. The West Country and much of East Anglia have no licensed tracks at all, which means dogs trained in those regions travel to race — adding another layer of context to their results.
Scotland’s absence from the list is absolute. There are no GBGB-licensed tracks north of the border, and with the Greyhound Racing (Offences) (Scotland) Bill progressing through the Scottish Parliament, there is no prospect of that changing. Wales still has Valley Stadium in Ystrad Mynach, but the Prohibition of Greyhound Racing (Wales) Bill, introduced in September 2025 and approved 36-11 on general principles, could see that venue close between 2027 and 2030. If the Bill becomes law, the entire licensed circuit will be confined to England.
For results analysis, the geography matters because it determines which tracks generate the most data. Venues that run frequent BAGS sessions — Sunderland, Central Park, Kinsley, Doncaster — produce the highest volume of results, sometimes hosting two or three meetings in a single day. Tracks that run primarily evening fixtures — Romford, Hove, Nottingham — produce fewer total races but at a generally higher competitive standard. The sheer volume of data from a BAGS-heavy venue can be misleading if you do not account for the quality differential.
Each track also has its own relationship with specific trainers and kennels. Most licensed trainers are based within reasonable travelling distance of their primary track, which means certain yards dominate at certain venues. A trainer who runs 80% of their dogs at Monmore will have an intimate knowledge of the surface, the bends, and the pace dynamics that a visiting trainer simply cannot match. This creates venue-specific form patterns that only become visible when you filter results by track rather than viewing them in aggregate.
Track Profiles: Distances, Surfaces, Grades
Every GBGB-licensed track has a standard race distance — usually in the range of 450 to 500 metres for sprint races — but the variation between venues is more significant than those numbers suggest. Track circumference, the length of the home straight, the sharpness of the bends, and the surface composition all create a unique racing environment that affects everything from finishing times to interference frequency.
Romford is one of the tighter circuits in the country, with a circumference of around 375 metres and sharp bends that reward dogs with quick acceleration out of the turns. The standard distance is 400 metres, and a competitive A-grade time is typically in the low 24-second range. Hove runs a more galloping track with gentler bends, and its 500-metre standard distance produces times in the 29-to-30-second window for top-grade races. The difference is not just about distance — a dog that handles Romford’s tight bends may struggle to sustain its form at Hove, where the wider circuit rewards a different running style entirely.
Surface is another variable that shapes results more than most casual observers realise. All GBGB tracks use sand-based racing surfaces, but the specific composition — the ratio of sand to fibre, the depth, the drainage properties — varies between venues and is maintained to different standards depending on the track’s investment in groundskeeping. Surface conditions change with the weather and the season. A track that drains well will produce fast times after rain, while a poorly drained surface becomes heavy and slows every runner. The going description — fast, standard, or slow — should always be checked alongside finishing times to avoid misleading comparisons.
Standard race distances at each venue also determine which dogs run there. Sprint-focused tracks like Romford (400m), Oxford (450m) and Sunderland (450m) attract a different type of runner from middle-distance or stayer-friendly venues like Towcester, which offers distances up to 680 metres. If you are comparing a dog’s results across multiple tracks, the distance profile is the first thing to check. A dog that dominates over 480 metres at Monmore may never have been tested over 600 metres, and there is no guarantee its form will transfer to a longer trip.
The middle tier of tracks — venues like Nottingham, Sheffield and Doncaster — tends to offer the broadest range of distances and often provides the most balanced test of a greyhound’s all-round ability. These tracks typically card races from 480 metres up to 660 or beyond, and a dog that performs consistently across those distances at a mid-tier venue is often a more reliable form proposition than one that has only raced at a single-distance track. When studying results, pay attention to whether a dog has proven itself over multiple trips or has been kept to a narrow distance range by its trainer.
Grading is nominally consistent across all GBGB tracks — the A1 to A10 structure applies everywhere — but in practice, the quality within each grade varies by venue. An A3 race at Romford, where the racing population is deeper and more competitive, is typically a tougher contest than an A3 at a smaller venue with fewer dogs in training. This is one of the recurring traps in greyhound form analysis: the grade looks the same on paper, but the actual strength of the field can differ markedly from one track to the next.
For anyone filtering results by track, these profiles are not background detail. They are the lens through which every finishing time, every margin, and every SP should be interpreted. A dog that posts a modest time at Hove might have run a perfectly creditable race on a slow surface in heavy going. A dog that wins by six lengths at Kinsley might have faced a genuinely weak field in a grade that attracts fewer runners. The profile tells you which of those results to take seriously and which to discount.
How Track Geometry Affects Results
Circuit geometry is the hidden variable in greyhound racing results. Two tracks can run races over the same nominal distance and produce entirely different race dynamics, because the shape of the circuit — the bend radii, the straight lengths, the position of the traps relative to the first turn — changes how the race unfolds from the moment the lids go up.
The critical dimension is the run to the first bend. At tracks where the traps are close to the opening turn, the break from the boxes is decisive. A dog that gets away quickly and hits the bend on the rail has an enormous positional advantage, because the field has had no time to sort itself out and the inside runner gets the shortest route through the turn. At tracks with a longer run-in — where there is 30 or 40 metres of straight before the first bend — the field has more time to find its positions, and early speed matters less than mid-race pace and tactical awareness.
Bend radius is the second key factor. Tight bends — the kind found at Romford and at the now-closed Crayford — compress the field and create more crowding on the turns. This favours railers, penalises wide runners, and produces more interference incidents. The finishing times at tight-bend tracks tend to be less reliable as pure performance indicators, because a dog’s result depends so heavily on whether it got a clear run. Wider bends, like those at Towcester or Nottingham, allow the field to spread out and produce racing that is more representative of each dog’s actual ability.
The home straight matters too. A long final straight gives dogs that finish strongly a genuine chance to overhaul leaders tiring after the final turn. A short straight protects front-runners — if you are still in front at the last bend, there simply is not enough track for anything to catch you. This is why certain dogs repeatedly win at specific tracks and consistently disappoint at others. Their form is not inconsistent. The geometry either suits their running style or works against it.
For results analysis, the practical takeaway is that you should never compare raw finishing positions across different tracks without accounting for geometry. A dog that finishes third from a wide draw at Romford, where the tight bends penalise outside runners, may have run a more impressive race than a dog that won from Trap 1 at a wider circuit where the rail advantage handed it the race. The result says one thing. The track geometry says something quite different. Reading both is what separates track-by-track analysis from naive number-crunching.
One more dimension: wind exposure. Open-air tracks like Kinsley and Sunderland are more affected by crosswinds than enclosed or semi-enclosed venues. Wind alters race dynamics by favouring runners on the sheltered side of the circuit and slowing those exposed to headwinds on the straights. On a gusty afternoon, the results at an exposed track can look erratic — short-priced favourites getting beaten, outsiders posting unexpectedly fast times from sheltered draws. Always check conditions alongside the track profile before drawing conclusions from a single card’s results.
Favourite Win Rates by Venue
If there is a single statistic that illustrates why track-by-track analysis matters, it is the favourite win rate. Nationally, favourites win around 35.67% of graded greyhound races — a figure that has remained broadly stable across recent seasons. But that national average conceals enormous variation at the venue level. At Kinsley, the favourite win rate in 2024 was just 31.60%. At The Valley, it reached 42%. That gap of more than ten percentage points means the betting market behaves very differently depending on where you are looking.
The reasons for the variation are rooted in the track characteristics covered above. At venues with tight circuits and short runs to the first bend, interference plays a larger role. Favourites — typically the highest-rated dog in the field on recent form — can be undone by a poor break or by crowding on the turns. At more spacious tracks with wider bends, the class differential tends to assert itself more reliably, and the favourite’s ability is more likely to translate into a winning performance.
Field size also plays a part. Some tracks regularly card six-runner fields, while others occasionally run five-runner races due to withdrawals or thin grading pools. In a five-runner race, the favourite has a higher natural win probability — 20% versus 16.7% in a six-runner field — and the smaller field reduces the likelihood of interference. Venues that run more five-runner races will naturally produce higher favourite win rates even if the quality of the favourites is identical.
Trap draw interacts with favourite win rates in ways that are often overlooked. Trap 1 posts a national win rate of roughly 18–19%, sitting above the theoretical average. When the favourite is drawn in Trap 1 at a track where the rail advantage is particularly pronounced, the win probability for that specific configuration may be well above the venue’s overall average. Conversely, a favourite drawn in Trap 6 at a tight circuit faces a structural disadvantage that the market does not always reflect.
What does this mean in practical terms for reading results by track? A favourite winning at Kinsley is a mildly surprising event relative to the venue’s own baseline, while a favourite winning at The Valley is routine. The tricast dividends at venues with lower favourite win rates will, on average, be larger — because the finishing order is less predictable and the tote pool distributes more to unusual combinations. If you are studying results with an eye on tricast patterns, the venue’s favourite win rate is the starting point of that analysis.
Accessing Results for a Specific Track
Filtering results by track is the most practical step you can take if you are serious about venue-specific form. Rather than scrolling through every race from every meeting, narrow the data to the track you care about and work with a concentrated dataset that actually tells you something.
Most results providers allow filtering by venue either on the main results page or through a dedicated track-by-track interface. The data you should expect for each track includes the full card — every race, in order, with finishing positions, trap numbers, dog names, trainers, race times, SPs, and forecast and tricast dividends. Some providers supplement this with race comments, sectional times and going descriptions, though coverage of these fields is uneven.
For form analysis, the minimum useful dataset for a single track is the last four to six weeks of results. That window gives you enough races to identify patterns — which trainers are running hot, which grades are most competitive, which trap draws are producing — without drowning in data that has gone stale. Beyond six weeks, results start to lose relevance because dogs move between grades, tracks undergo surface maintenance, and the form landscape shifts.
If you are following a specific dog, the track filter is essential for separating home-track form from away performances. A dog that has run eight times at Monmore and twice at Dunstall Park may have a strong record at Monmore that vanishes at Dunstall Park. Filtering by venue lets you isolate those local patterns and avoid overweighting results from a track that does not suit the dog’s running style.
A commonly overlooked use of the track filter is to compare the same race grade across multiple venues. An A4 at Hove and an A4 at Sunderland share a label but not necessarily a competitive standard. By pulling up recent A4 results from both tracks and comparing finishing times, margins and SP distributions, you get a clearer picture of what the grade actually signifies at each venue — essential information when a dog transfers from one track to another.
Flapping Tracks vs GBGB-Licensed Venues
Every result discussed on this page comes from a GBGB-licensed track — one of the 18 venues regulated by the Greyhound Board of Great Britain. But they are not the only places where greyhound races take place in the UK. Alongside the licensed circuit, a parallel tier of unlicensed venues exists: the “flapping tracks.” The distinction between the two is critical for anyone who takes results data seriously.
GBGB-licensed tracks operate under a formal regulatory framework. Dogs must be registered. Trainers must be licensed — there are approximately 500 of them, handling around 6,000 newly registered greyhounds per year. Races are graded according to a standardised system. Drug testing is conducted. Stewards are present at every meeting. Results are officially recorded, timestamped, and published. The entire data chain — from the registration of the dog to the confirmation of the result — is auditable. This is the infrastructure that makes systematic form analysis possible.
Flapping tracks operate outside this framework entirely. The dogs may or may not be registered. The racing may or may not follow formal grading. There is no standardised drug testing, no stewards’ oversight, and no guarantee that results are recorded or published in any consistent format. Some flapping tracks are well-run independent operations with a loyal local following. Others are considerably less transparent. The common thread is that the data produced at flapping tracks cannot be relied upon in the way that GBGB data can. You cannot meaningfully grade a dog’s performance at a flapping track against its licensed form, because the conditions under which the race took place are not comparable.
As former GBGB Chief Executive Mark Bird noted, licensed racing ensures that greyhounds receive proper care and attention, benefiting from greater protections than even domestic pets — with the data to demonstrate that welfare standards are genuinely robust. That regulatory architecture is not just about animal welfare, though that is its most visible function. It is also about data integrity. When a result comes from a GBGB track, you know the race was run under consistent rules, at a measured distance, on a maintained surface, with identified and registered dogs. When a result comes from a flapping track, you know none of those things with certainty.
For punters, the practical advice is straightforward: if you are building a form database, build it from GBGB results. If a dog’s form line includes runs at unlicensed venues, treat those results with scepticism. They may have been won against ungraded opposition, over unmeasured distances, on surfaces with unknown characteristics. That does not make them entirely worthless — a win is still a win — but it makes them unreliable as data points in any structured analysis. The 18 licensed tracks produce more than enough results to keep any serious analyst busy. There is no reason to compromise the dataset with unregulated data.