UK Greyhound Results — Every Track, Every Race, Full Archive
Every race. Every track. Data that matters.
Comprehensive results data from all 18 GBGB-licensed stadiums — starting prices, sectional times, trap draws, grading context and welfare metrics. The single reference point for every licensed venue, every race distance and every data point that shapes UK greyhound racing.
Best Greyhound Betting Sites – Bet on Greyhounds in 2026
Loading...
What the Numbers Behind Every UK Greyhound Finish Actually Tell You
- All 18 GBGB-licensed tracks feed into a single results ecosystem covering roughly 25,000 BAGS races per year, plus open and evening fixtures — so daily volume is enormous.
- Favourites win about 35.67% of graded races nationally, but venue-level variation is significant: from 31.60% at Kinsley to 42% at The Valley.
- Trap 1 holds a slight statistical edge at around 18–19% win rate, above the theoretical 16.6% baseline — worth noting when reading any racecard.
- On welfare, GBGB's 2024 injury rate hit a record low of 1.07%, and 94% of retired greyhounds were successfully rehomed — but legislative bans are advancing in both Wales and Scotland.
- Understanding SP, BSP, grading and sectional times turns raw results into actionable form data — this guide breaks down each element.
Today's Results Overview
On any given day in Britain, greyhound racing produces a staggering volume of data. The Bookmakers Afternoon Greyhound Service — BAGS — alone accounts for more than 25,000 races annually, spread across 74 meetings per week at licensed tracks. Add evening fixtures, open races and feature events to the mix, and you are looking at somewhere between 80 and 120 individual races on a busy day. That is a lot of finishes to process, and it is precisely why knowing how to navigate today's results efficiently separates the informed punter from the casual browser.

Results typically update within minutes of a race finishing. Each result line contains a set of core data points: finishing positions for all six runners, the Starting Price of each dog, the winning time, sectional splits where available, and forecast and tricast returns. On BAGS fixtures, results feed directly into bookmaker platforms and data services in near real-time, which means that if you are following a day's racing from a screen rather than trackside, you are rarely more than a couple of minutes behind the action.
What a Typical Race Day Looks Like
A standard BAGS afternoon card runs from around 11:00 to 16:30, with races scheduled at roughly 15-minute intervals across multiple tracks simultaneously. Evening meetings at venues like Romford, Hove or Sheffield kick off between 18:30 and 19:00 and typically feature 12 to 14 races. The density of the schedule means that form students tracking results across several venues need a system — or at the very least, a clear sense of which tracks and race grades are worth their attention on a particular day.
Not every race carries the same analytical weight. A graded A1 contest at Nottingham tells you something quite different from an A8 at Sunderland, even if both produce a winner, six finishing positions and a set of SPs. Context matters. The grade of the race, the distance, the track geometry and the quality of the field all shape what a result actually means in form terms. We will unpack each of those elements in the sections that follow.
Feature Events and Calendar Highlights
Beyond the daily BAGS schedule, certain dates carry particular significance. The spring and summer months are packed with Category One and Category Two stakes — headline events that attract the best greyhounds in the country and generate the most closely watched results of the year. The English Greyhound Derby, run over 500 metres at Towcester, remains the sport's flagship competition with a winner's prize of £175,000.
Centenary milestone: On 7 March 2026, Dunstall Park in Wolverhampton hosted the first-ever combined horse racing and greyhound racing fixture in Britain — a one-off event marking the sport's centenary year. It is the kind of calendar moment that generates results data with genuine historical context.
Keeping track of these highlights alongside routine BAGS racing gives you a fuller picture of the results landscape. A dog posting a strong time in a Tuesday afternoon A3 at Crayford is useful information. That same dog running in a Category Two semi-final at Hove the following Saturday is a different proposition entirely — and the results of both races need to be read accordingly.
Results by Track: All 18 GBGB Venues
The geography of UK greyhound racing is almost entirely English. Of the 18 GBGB-licensed stadiums currently operating, 17 are in England and one — Valley Stadium at Ystrad Mynach — is in Wales. Scotland has no active licensed tracks, a situation that predates the current legislative push to ban the sport north of the border. This concentration means that results data is heavily weighted towards English venues, particularly those in London, the Midlands and the North.
Each track has its own character. Romford and Crayford serve London and the South East with high-frequency BAGS and evening fixtures. Hove covers the South Coast. Monmore Green and Dunstall Park anchor the Midlands. Sheffield's Owlerton Stadium, Newcastle's Brough Park and Sunderland represent the North. Towcester, home of the English Greyhound Derby, sits in Northamptonshire and hosts both routine racing and the sport's marquee events. The remaining venues — Nottingham, Kinsley, Central Park (Sittingbourne), Doncaster, Oxford, Yarmouth, Suffolk Downs, Swindon and The Valley (Ystrad Mynach) — fill out the circuit with varying race frequencies and grade structures.
As GBGB Chairman Sir Philip Davies noted in his spring 2026 awards speech: "This year sees greyhound racing in the UK celebrate our centenary, marking 100 years since racing first took place at Belle Vue Greyhound Stadium in 1926." From one stadium to 18 licensed venues — and from 1,700 curious spectators to an industry supporting roughly 500 trainers, 15,000 registered owners and around 6,000 greyhounds registered annually — the scale of the sport has changed beyond recognition. Notably, over 80% of greyhounds racing in Britain are imported from Ireland, making the cross-Irish-Sea pipeline a defining feature of the UK racing ecosystem.
How Track Identity Shapes Results
Results from different venues are not directly interchangeable. A 29.50-second 480-metre time at Romford does not translate neatly to a 480-metre time at Monmore, because the two tracks differ in circumference, bend geometry, running surface condition and trap positioning. Some tracks favour early-pace dogs that break cleanly from the traps. Others reward runners with stamina and the ability to navigate tight bends without losing ground. Understanding these differences is essential when comparing results across venues — and it is the reason why experienced form analysts treat each track's data as a separate dataset rather than lumping everything together.
Accessing Results by Venue
Most results services allow filtering by track. GBGB publishes official results on its website, and third-party platforms like Timeform, RPGTV and individual bookmaker sites offer venue-specific archives. If you are focused on a particular stadium — say you follow Romford racing regularly or you are building a form database for Hove — filtering by track is the first step. From there, you can sort by date, race grade, distance or individual dog to drill down into the specific results that matter for your analysis.
The practical value of track-level results lies in their consistency. A dog's form at a given venue over its last five or six runs paints a much more reliable picture than scattered results across three or four different tracks. The surface, the bends, the trap draw and even the local competition pool all remain constant, giving you a controlled dataset to work with.
How to Read a Greyhound Racecard
A greyhound racecard looks dense at first glance — a compressed grid of numbers, abbreviations and colour codes that can overwhelm anyone not already familiar with the format. But once you know what each element represents, the card becomes a powerful analytical tool. Everything you need to assess a race is on that single page: the runners, their recent form, the trap draw, the grade of the contest and the prices being offered by the market.

The Trap Draw and What It Signals
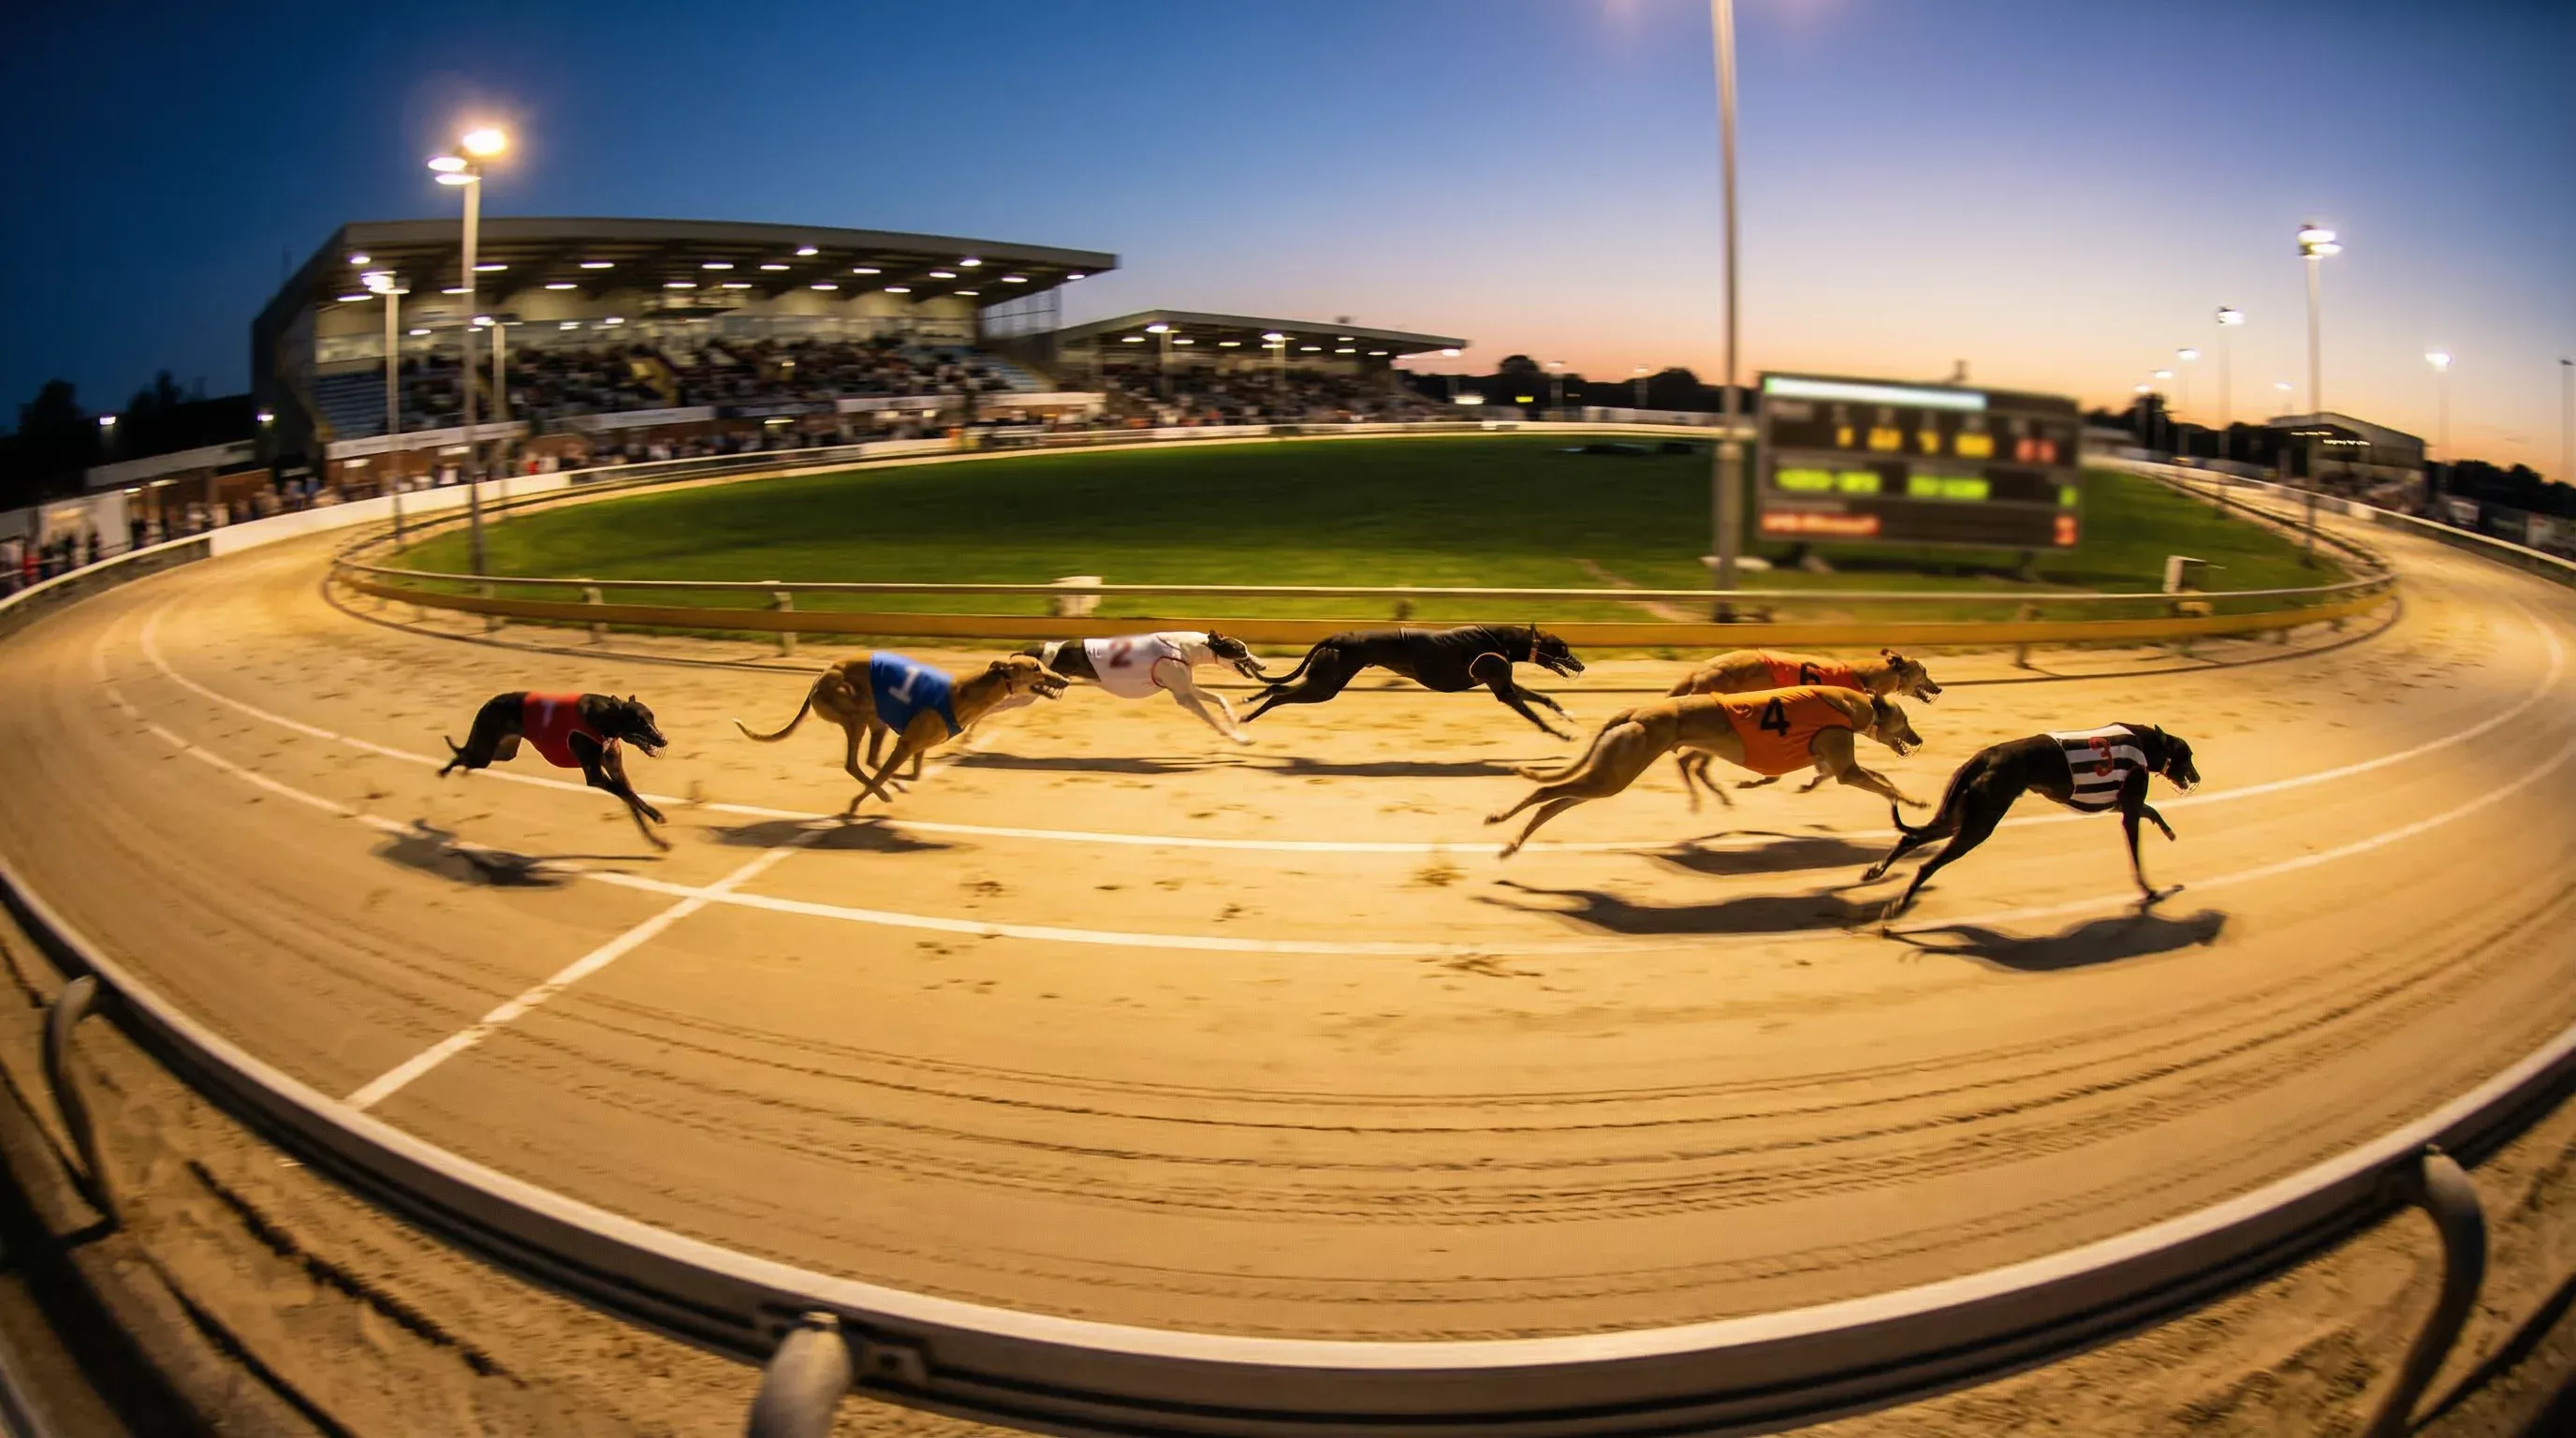
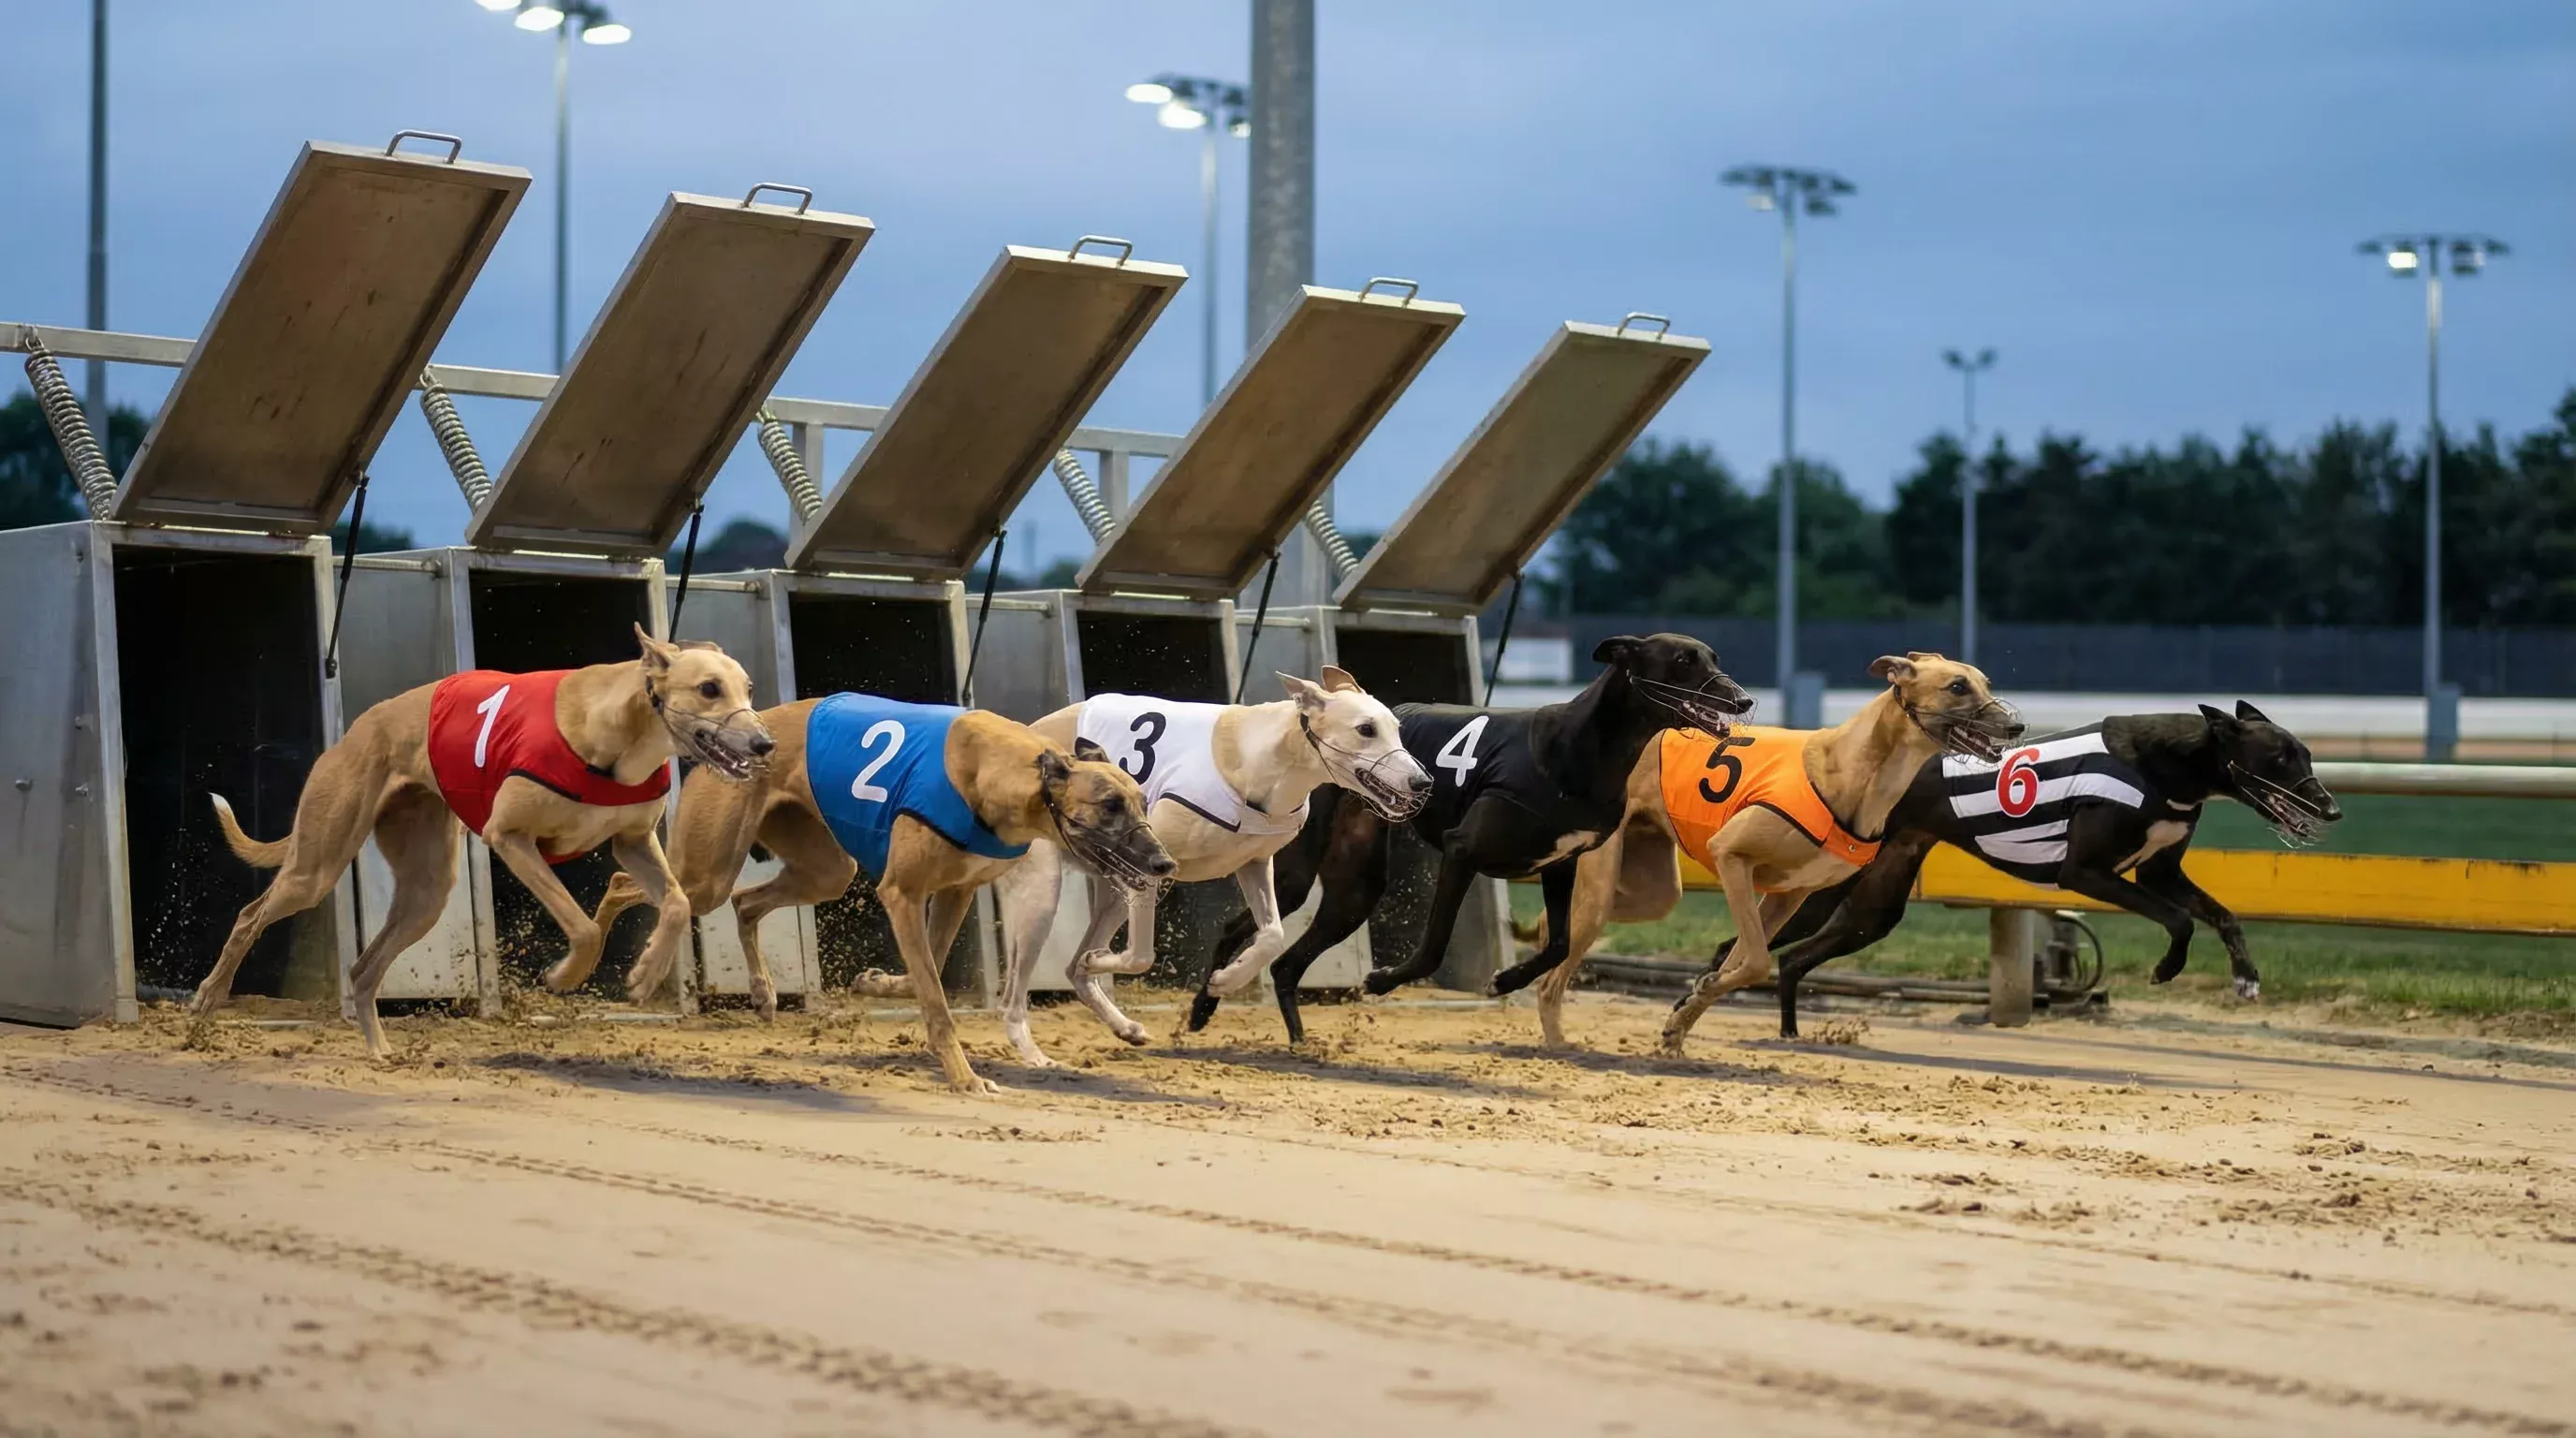
Every greyhound race in the UK uses six traps, numbered 1 through 6, each assigned a colour: red, blue, white, black, orange and striped (black and white). The trap number is the first piece of information on any racecard, and it is far from arbitrary. Trap position matters because it determines where a dog starts relative to the first bend. Dogs in lower-numbered traps (especially Trap 1) have the rail advantage on left-handed tracks, which is the standard configuration at most UK venues.
The statistics back this up. Across UK licensed tracks, Trap 1 produces a win rate of approximately 18–19%, noticeably above the theoretical baseline of 16.67% if all six traps were equally likely to win. The advantage is not enormous, but it is persistent enough to show up in aggregate data year after year. This does not mean you should blindly back every Trap 1 runner — but it does mean that when two dogs look closely matched on form, the one drawn in the red box has a small structural edge.
Form Lines and Recent Runs
Below the trap number, the racecard lists each dog's recent form — typically the last six runs, displayed as a string of digits representing finishing positions. A form line of 111243 tells you this dog has won three of its last six starts, placed second once, finished fourth once and third once. That is strong form. A line reading 665450 paints a very different picture. Reading these sequences quickly and accurately is the core skill of racecard analysis.
But form lines are not the whole story. A dog finishing second in an A1 race at Hove was probably running against much stronger opposition than one winning an A7 at Kinsley. The grade context — which we will cover in detail below — determines the quality of the competition and therefore the meaning of each position. A second-place finish is not always worse than a first.
Times, Distances and Sectional Data
Winning times appear in seconds and hundredths (for example, 29.54 over 480 metres). These matter, but they need context. Track-specific factors — surface condition, weather, time of year — all influence times. A more useful metric for comparison is sectional time: the time a dog takes to reach a specific point on the track, usually the first bend or the halfway mark. Sectional data tells you whether a dog is an early-pace runner that leads from the traps or a closer that finishes strongly through the field.
Distance beaten is recorded in lengths (abbreviated as "l") and fractions. If the result shows the winner finishing 2¼ lengths ahead of the second dog, that translates to a meaningful gap of around 0.3 seconds at a standard 480-metre trip. These margins are small but they accumulate across a dog's form profile, and they are particularly useful for assessing a runner's consistency.
Trainer, Owner and Weight
The racecard also lists the trainer, owner and the dog's racing weight. Trainer form is an underappreciated data point in greyhound racing. A kennel sending out multiple winners from the same meeting is often a signal that the dogs are in peak condition and well prepared. Weight fluctuations can indicate a dog's fitness or readiness — a significant gain or loss between runs is worth investigating, even if it does not always have a straightforward explanation.
Understanding SP and BSP
Two abbreviations appear in virtually every greyhound result: SP and BSP. They both refer to prices — the odds at which bets are settled — but they originate from fundamentally different mechanisms. If you are reading results to assess form or evaluate market confidence, understanding the distinction is not optional. It is the difference between knowing what the bookmakers thought and what the exchange crowd believed.
SP: The Starting Price
SP stands for Starting Price. It is the final price offered by on-course bookmakers at the moment the traps open. In practice, a representative from the Starting Price Regulatory Commission (SPRC) records the available odds from on-course layers immediately before the off, and the resulting price is declared as the official SP. If you placed a bet at "SP" with your bookmaker, this is the price your bet is settled at — regardless of whether the early-morning price was shorter or longer.
The SP serves as the industry's official benchmark. It appears in every published result and is the standard reference point when historical form data lists the odds of past runners. When analysts talk about a "well-backed favourite" or a "drifter", they are almost always referring to movements relative to the SP. A dog that opened at 3/1 in the morning and returned an SP of 6/4 was supported heavily throughout the day. One that opened at 2/1 and returned at 5/1 saw money flowing elsewhere.
The scale of the market behind these prices is significant. Off-course betting turnover on greyhound racing reached approximately £794 million in the financial year April 2023 to March 2024. Greyhound racing accounts for roughly 12.8% of total betting shop turnover — a substantial share that ensures SP formation is driven by genuine market liquidity rather than thin, unreliable odds. A portion of that turnover feeds back into the sport: in 2024–25, the British Greyhound Racing Fund (BGRF) collected £6.75 million from voluntary bookmaker contributions at a rate of 0.6% of greyhound betting turnover — funding that supports prize money, welfare programmes and track infrastructure.
BSP: Betfair Starting Price
BSP is the Betfair Starting Price, calculated on the Betfair Exchange. Unlike SP, which is determined by bookmaker odds, BSP is derived from the unmatched bets remaining in the exchange market at the moment the race starts. Betfair's algorithm matches these residual back and lay orders and produces a single price that reflects exchange-market opinion at the off.
BSP tends to differ from SP, sometimes significantly. On short-priced favourites, BSP is often slightly more generous because exchange layers are willing to offer fractionally better odds than bookmakers. On outsiders, the reverse can be true — exchange liquidity on longer-priced runners in greyhound racing is thinner than in horse racing, and BSP can occasionally be lower than SP when there is limited back money in the market.
Which Price Matters More?
For form analysis purposes, SP is the standard. It is universally recorded, historically consistent and available across all results platforms. BSP adds a layer of market intelligence — particularly useful if you are tracking value by comparing the two prices over time — but it is not always published in standard results feeds. If you are building a form database, SP is the baseline. If you are assessing betting value retrospectively, comparing SP and BSP on the same race tells you whether the bookmaker or the exchange offered the better deal.
The key takeaway: SP tells you what the traditional market concluded. BSP tells you what the exchange crowd concluded. Where the two diverge, there is usually a story — a late gamble, a piece of inside information filtering through, or simply a difference in how each market weights the available data.
The UK Grading System Explained
Every graded greyhound race in the UK operates within a structured system designed to match dogs of similar ability against each other. This is not like horse racing, where handicaps and weight-for-age scales level the field. In greyhound racing, the grading system itself determines which dogs run in which races — and understanding that system is essential to interpreting results correctly.
The A-Grade Ladder
The core of the system is the A-grade structure, running from A1 (the highest standard of graded racing) down to A10 or A11 at some tracks. A dog's grade is determined primarily by its recent race times at the venue where it is entered. Faster times push a dog up the grades; slower times or poor results bring it back down. Each track maintains its own grading bands, calibrated to the local competition pool, which means that an A3 at Romford is not necessarily equivalent to an A3 at Sunderland. The dogs may be running at similar grades in name, but the actual time thresholds and field quality can differ substantially.
When a dog wins a graded race, it is typically promoted one or two grades for its next outing. When it finishes out of the first three, it may be dropped. This constant re-grading means that the competitive balance of any individual race is always in flux — and it is why a dog's current grade, read alongside its recent form, tells you far more than either data point in isolation.
Open Races and Category Stakes
Above the A-grade ladder sit open races and category stakes — the elite tier of UK greyhound competition. Open races are unrestricted by grade: any qualified dog can be entered, and the field is assembled based on form and reputation rather than a grading band. Category One events are the pinnacle, with the English Greyhound Derby leading the calendar. Category Two, Three and Four races step down in prestige and prize money, but all sit above standard graded fare in terms of competitive quality.
The financial gap between graded and open racing is considerable. The UK's total annual prize fund stands at approximately £15.7 million across all licensed racing, but a disproportionate share flows to the top-tier events. A graded race at a midweek BAGS meeting might offer a winner's prize of a few hundred pounds. A Category One final can pay out tens of thousands. That prize-money gap reflects the quality gap — and it means that results from open races carry significantly more analytical weight than routine graded contests.
Why Grading Context Matters for Results
The practical implication is straightforward: never read a result without checking the grade. A dog winning an A7 race in a fast time might look impressive on paper, but if it has been dropped from A3 after a string of poor runs, that "win" is really a dog performing below its ceiling against weaker opposition. Conversely, a third-place finish in an A1 race might represent a career-best effort against top-class rivals. The grade gives you the competitive context that raw positions and times cannot provide on their own.
Grading also interacts with trap draw and track characteristics. At some venues, lower grades tend to produce more chaotic races — more bumping on bends, more inconsistent early pace, more upsets. At higher grades, the standard of trapping and racing manners improves, and results tend to be more predictable. This is worth bearing in mind when you see headline statistics about favourite win rates: those figures often vary significantly between the top and bottom of the grading spectrum.
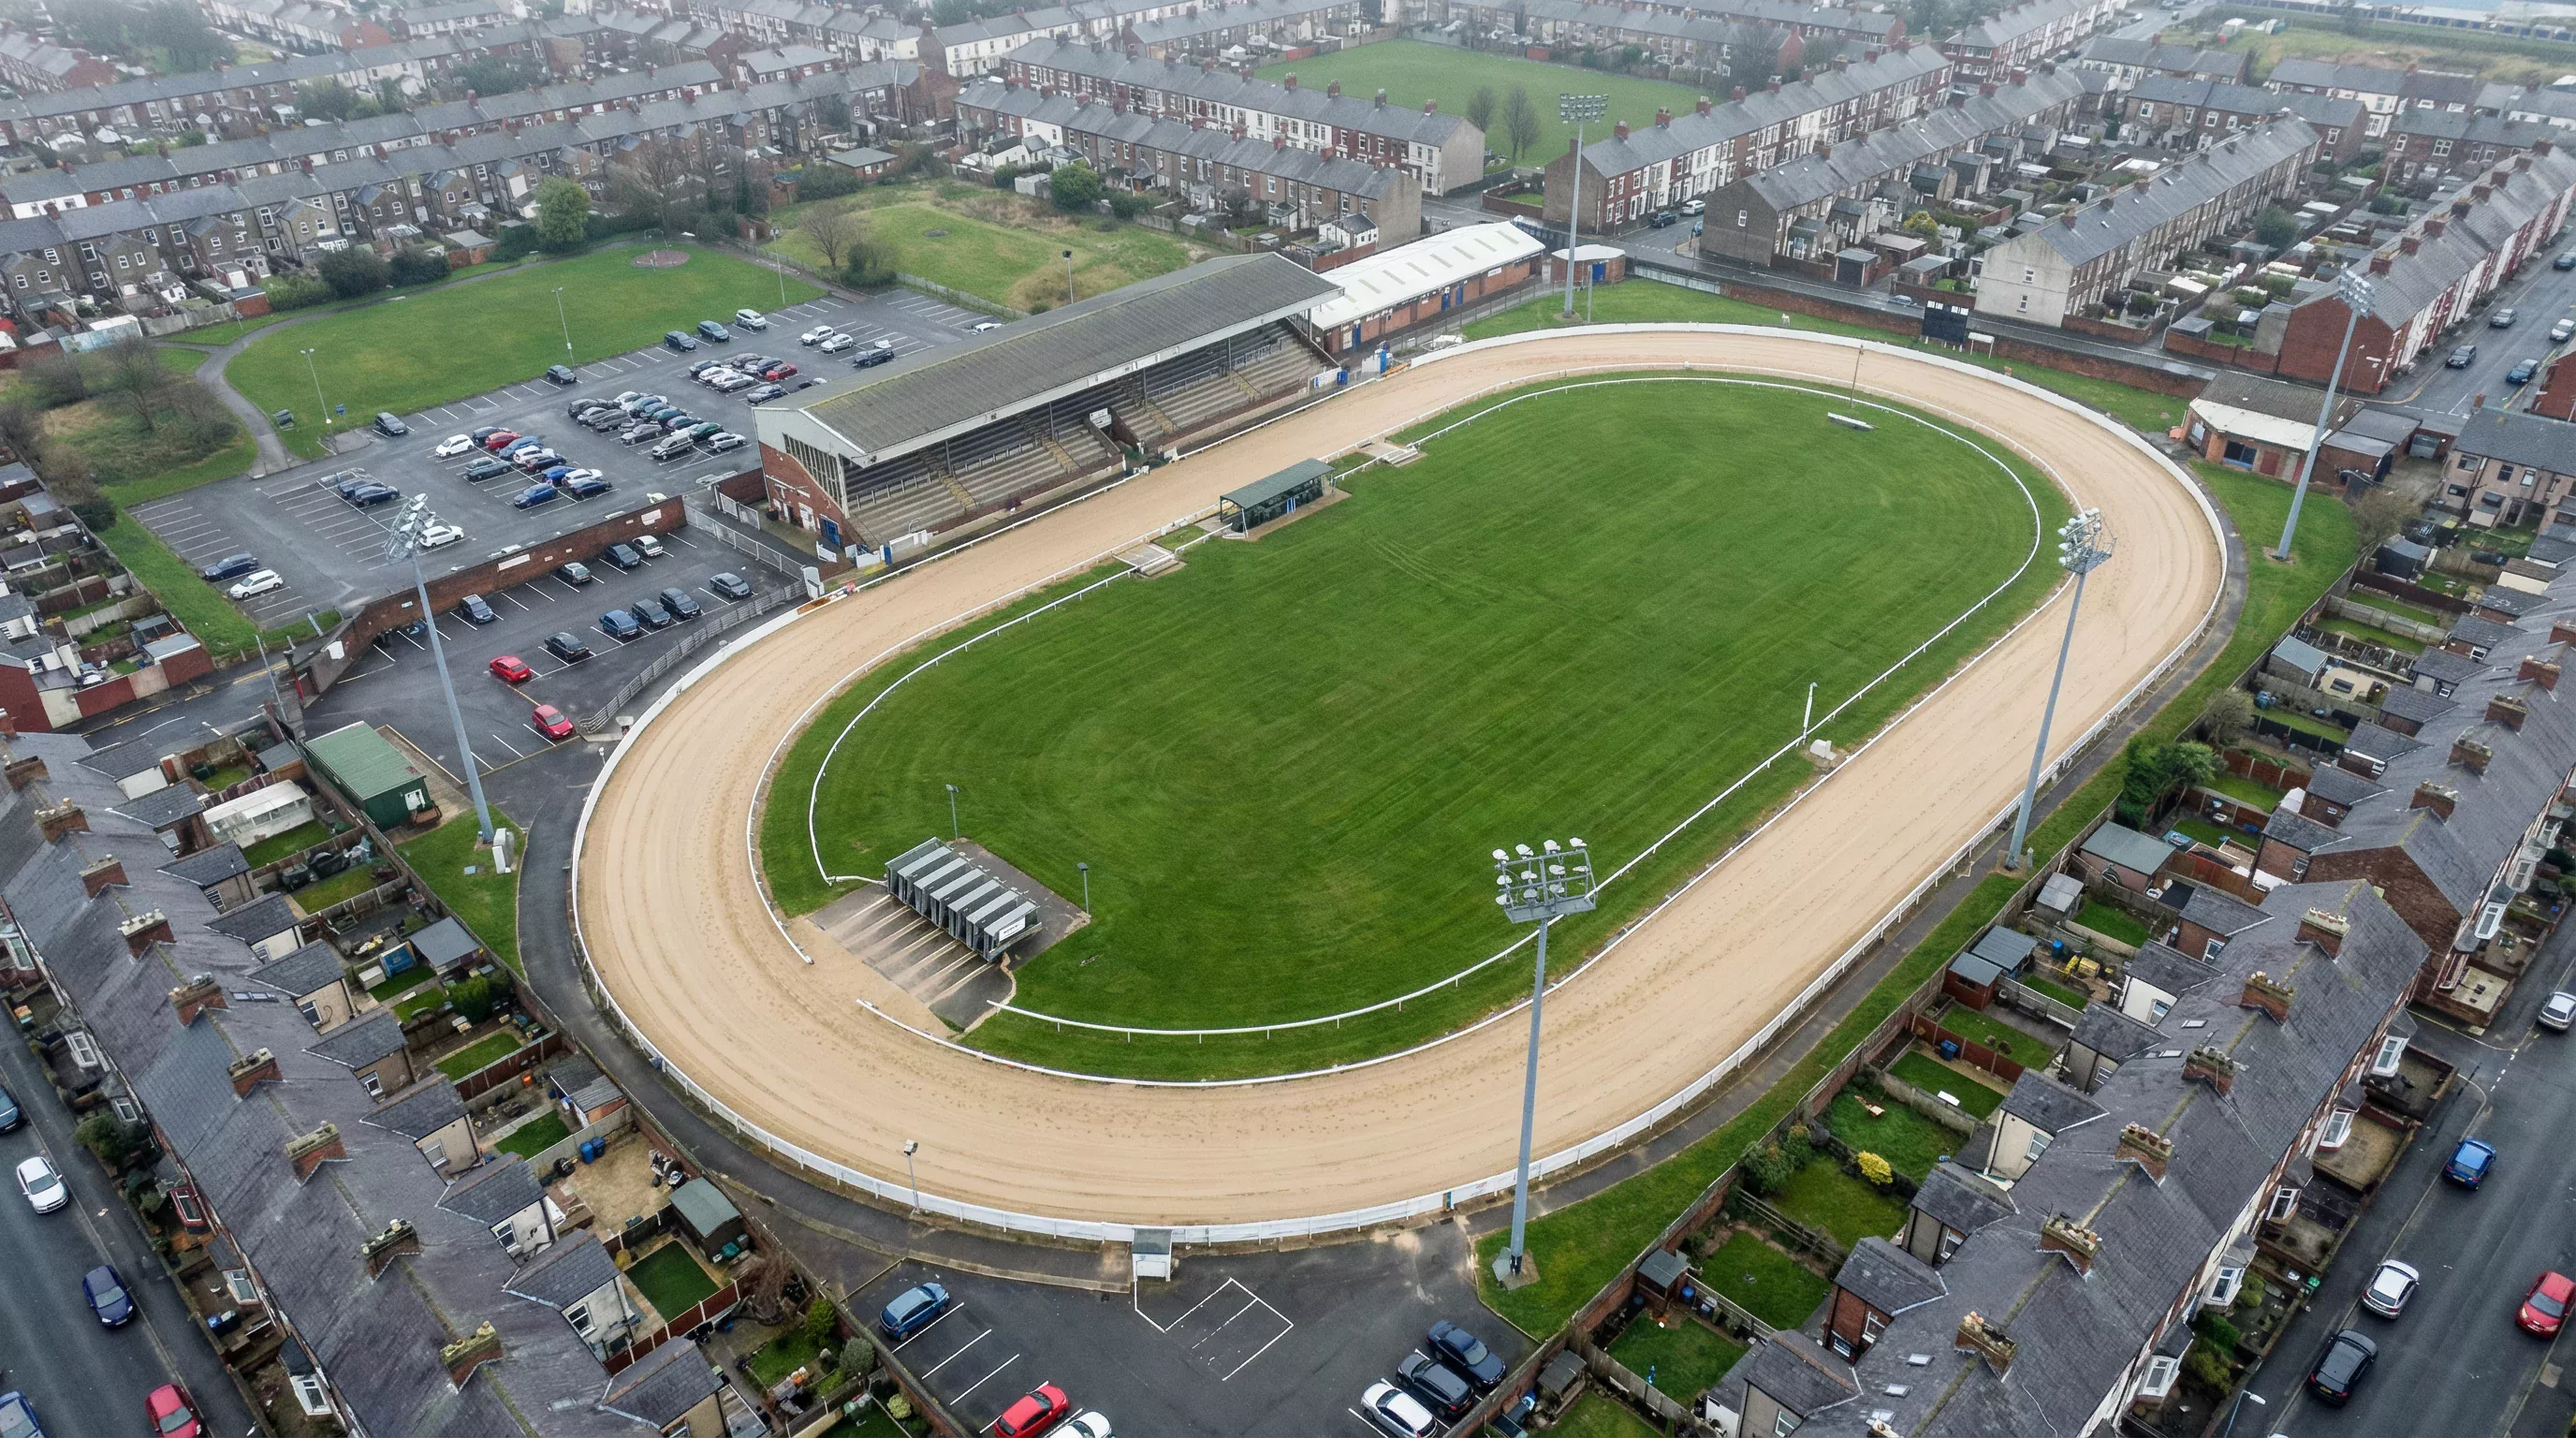
Track Map: Where Greyhounds Race in Britain
The distribution of licensed greyhound tracks across Britain tells its own story. All 18 GBGB venues are clustered in England and Wales, with a heavy concentration in the South East, the Midlands and pockets of the North. Scotland has no licensed tracks — its last stadium closed years ago. Wales has one active venue, Valley Stadium in Ystrad Mynach, though its future is uncertain given current legislative moves (covered in the welfare section below).
Regional Breakdown
London and the South East dominate the schedule. Romford, Crayford and Central Park (Sittingbourne) between them provide a near-daily supply of results for punters in the region. Hove and Oxford extend the southern footprint. The Midlands are anchored by Monmore Green and Dunstall Park in the West Midlands, with Nottingham and Towcester covering the East Midlands corridor. Further north, Sheffield, Doncaster, Kinsley, Sunderland and Newcastle offer coverage across Yorkshire, the North East and the wider North of England. Swindon and Yarmouth sit as relative outliers in the South West and East Anglia respectively.
This geographic spread has practical consequences for results data. Most tracks serve both a local audience (punters who attend in person or follow "their" track regularly) and a national one (bettors watching via BAGS streams or checking results online). The local dimension matters because each venue develops its own micro-ecosystem of regular trainers, kennel form patterns and track-specific tendencies. The national dimension matters because the results are aggregated across all 18 venues in the databases used by serious form analysts.
The Shrinking Map
It is worth noting that 18 licensed tracks represents a significant contraction from the sport's peak. At its height, the UK had more than 60 licensed greyhound stadiums. The decline has been driven by property development pressure — greyhound tracks, often located on prime urban land, have been sold for housing and retail — and by falling attendances. The stadiums that remain tend to be either commercially viable through BAGS income or sustained by committed ownership groups.
Whether the map shrinks further depends in large part on the legislative outcomes in Wales and Scotland, and on the broader economics of the sport. The centenary year celebrations in 2026 have brought a burst of positive attention, but the structural pressures remain. For now, 18 tracks generate the full UK results picture — and every one of them feeds data into the archive that forms the backbone of serious greyhound analysis.
Track Comparison Table
Comparing tracks is not just about listing distances and addresses. For anyone using results to inform selections, the meaningful comparisons are about performance patterns — how often favourites win at a given venue, what the typical winning times look like, and how the track layout influences race dynamics. The table below captures the key variables that differentiate one stadium from another in terms of results data.
| Track | Location | Standard Distances | Circumference | Favourite Win % (2024, Graded) |
|---|---|---|---|---|
| Romford | London (East) | 400m, 575m | ~375m | ~36% |
| Crayford | Kent | 380m, 540m, 714m | ~370m | ~35% |
| Hove | Brighton | 285m, 500m, 695m | ~400m | ~36% |
| Monmore Green | Wolverhampton | 264m, 480m, 630m | ~400m | ~35% |
| Dunstall Park | Wolverhampton | 280m, 480m, 660m | ~420m | ~36% |
| Sheffield (Owlerton) | Sheffield | 280m, 500m, 660m | ~400m | ~35% |
| Nottingham | Nottingham | 305m, 500m, 680m | ~410m | ~37% |
| Towcester | Northamptonshire | 270m, 480m, 500m, 640m | ~415m | ~36% |
| Newcastle (Brough Park) | Newcastle | 290m, 480m, 640m | ~395m | ~34% |
| Sunderland | Sunderland | 275m, 450m, 640m | ~380m | ~34% |
| Kinsley | West Yorkshire | 277m, 462m, 642m | ~370m | 31.60% |
| Doncaster | Doncaster | 280m, 480m, 660m | ~400m | ~35% |
| Oxford | Oxfordshire | 253m, 450m, 642m | ~395m | ~35% |
| Yarmouth | Norfolk | 277m, 462m, 659m | ~385m | ~35% |
| Central Park | Sittingbourne, Kent | 265m, 450m, 630m | ~375m | ~36% |
| Swindon | Wiltshire | 285m, 480m, 663m | ~385m | ~34% |
| The Valley | Ystrad Mynach, Wales | 270m, 450m, 620m | ~370m | 42% |
| Star Pelaw | County Durham | 255m, 435m, 590m | ~360m | ~35% |
The standout data points in the favourite column are at the extremes. Kinsley returns just 31.60% for favourites in graded races, making it the most unpredictable venue in the country. The Valley sits at the opposite end at 42%, a track where the market gets it right noticeably more often. The national average across all tracks in 2024 was 35.67%. If you are calibrating your expectations for a specific venue, these numbers are the baseline.
Circumference and bend tightness also deserve attention. Tighter tracks tend to produce more bunching on the bends, which creates more interference and more unpredictable results. Larger-circumference tracks allow dogs to maintain their running lines more cleanly, which generally favours form runners and, by extension, favourites. This partly explains why a venue like The Valley — a compact track with a small, regular field pool — produces high favourite win rates, while Kinsley's layout contributes to more open finishes.
Favourite Win Statistics and Trap Bias
Numbers do not lie, but they do require context. Two of the most frequently cited — and most frequently misunderstood — statistical patterns in UK greyhound racing are the favourite win rate and the trap bias. Both have genuine analytical value. Neither is a shortcut to profit. Getting the most out of these figures means understanding what they measure, where their limits are, and how they interact with the other variables on a racecard.
How Often Do Favourites Win?
In 2024, the market favourite won approximately 35.67% of all graded races across UK licensed tracks. That figure comes from aggregate data covering every GBGB venue and represents a consistent pattern that has held within a narrow range for years. Roughly one in three graded races is won by the dog that the market considers most likely to win. That is far from a certainty, but it is a meaningful edge over random selection.
The second favourite wins around 16–18% of the time. The third favourite adds another 17–20%. Taken together, the top three in the betting account for somewhere between 71% and 74% of all graded race winners. In other words, nearly three-quarters of races are won by one of the three shortest-priced runners. The remaining quarter is split between the fourth, fifth and sixth choices — each winning in just 5–8% of races.
These numbers have practical implications. If you are playing forecasts or tricasts, the probability of needing to include at least one of the top three in the betting is extremely high. If you are looking for value by backing outsiders, you are swimming against a strong statistical current. That does not make it impossible — some of the best returns come from correctly identifying when an outsider has been underpriced — but it does mean you need a clear reason to go against the market, not just a hunch.
Trap Bias: Real but Not a Silver Bullet
The trap bias is one of greyhound racing's most persistent statistical curiosities. Across all UK tracks, Trap 1 wins approximately 18–19% of races — roughly two percentage points above the theoretical baseline of 16.67% for a six-runner field. Trap 6 typically shows the weakest aggregate performance, though the specifics vary by track.
Why does this happen? The primary explanation is geometric. On a left-handed oval track (the standard UK configuration), the dog in Trap 1 has the shortest path to the first bend and the inside rail. This means it needs to travel fractionally less distance than its rivals, and it avoids the crowding and bumping that tends to affect middle and outside runners as the field compresses into the first turn. The advantage is small in absolute terms — we are talking about fractions of a length — but over thousands of races, it produces a measurable and statistically significant pattern.
The favourite win rate (35.67%) and the Trap 1 bias (18–19%) are real patterns confirmed by aggregate data. But they operate at the level of large samples, not individual races. Using them as one input among many is smart. Using them as a standalone betting strategy is not.
Track geometry modifies the bias. At venues with wider bends and longer run-ups to the first turn, the inside advantage is reduced. At tighter tracks, it is amplified. Some tracks even show a temporary Trap 6 bias at certain distances, where the outside draw gives a dog a clear run on the first bend without interference. Checking track-specific trap data — not just the national aggregate — is the sharper approach.
Where trap bias and favourite statistics intersect is in the racecard itself. A favourite drawn in Trap 1 has both the market's confidence and the geometric advantage. A favourite drawn in Trap 6 at a tight track faces a structural disadvantage that the odds may not fully reflect. These are the margins that serious results analysts look for — not guaranteed outcomes, but tilts in probability that add up over time.
Welfare and Safety on Licensed Tracks
Any honest discussion of UK greyhound results has to address what happens to the dogs that produce them. The welfare of racing greyhounds has been the sport's most contentious issue for decades, and the data now available — published annually by GBGB — makes it possible to assess the situation with specifics rather than generalities. The picture is complex: genuine progress on key metrics sits alongside ongoing criticism from animal welfare organisations and active legislative moves to restrict or ban the sport.

Injury and Fatality Rates
In 2024, the on-track injury rate across all GBGB-licensed stadiums fell to 1.07% — that is 3,809 injuries recorded across 355,682 individual race runs. It is the lowest rate in the history of GBGB record-keeping. The on-track fatality rate dropped to 0.03%, down from 0.06% in 2020. By any measure, the trend line is moving in the right direction.
The industry points to infrastructure investment as a key driver. The Sport Turf Research Institute (STRI) now visits every licensed stadium quarterly — double the previous frequency — to assess and improve running surfaces. In 2024, industry participants accumulated over 580 hours of continuing professional development, covering everything from track maintenance to greyhound health management. These are not headline-grabbing numbers, but they represent the kind of systemic work that gradually reduces injury incidence.
GBGB's 2024 data shows a record-low injury rate of 1.07% and a fatality rate of 0.03%. The trajectory is positive, but the absolute numbers — 3,809 injuries in a single year — remain substantial, and critics argue that any level of avoidable harm is too high for an activity driven by gambling.
Retirement and Rehoming
Of the 5,795 greyhounds that left racing in 2024, 94% were successfully retired through approved channels — either rehomed directly, placed through the Greyhound Retirement Service (GRS) or retained by owners and trainers. That is up from 88% in 2018, a meaningful improvement.
The most striking welfare statistic concerns economic euthanasia — greyhounds put down because their owners or trainers could not afford to keep or rehome them. In 2018, 175 dogs were euthanised for economic reasons. In 2024, the figure was three. Mark Bird, Chief Executive of GBGB, commented on the shift: "I am particularly proud of the progress we have made around economic euthanasia. As a Board, we have been clear that putting a greyhound to sleep for economic reasons is unacceptable and I am pleased that we have reduced this by 98% since 2018" — a position laid out in GBGB's 2024 welfare report.
Adoption numbers are also trending upward. In the first half of 2025, adoptions from approved GRS shelters rose 37% compared to the same period in 2024, suggesting that public appetite for rehoming retired greyhounds remains strong.
Professor Madeleine Campbell, a European Veterinary Specialist who led the development of GBGB's welfare strategy, has described the framework as aiming for a "world class" standard, noting that it drew on input from academics, specialists, vets and global animal welfare experts — as stated in her public comments to VetClick.
Jeremy Cooper, former Chair of GBGB and ex-Chief Executive of the RSPCA, added his own assessment before stepping down: that racing greyhounds are "now receiving the highest levels of care and protection than ever before" — a view published by Greyhound News UK.
The Legislative Picture
Despite the improving data, the political momentum in parts of the UK is firmly towards restriction. In Wales, the Prohibition of Greyhound Racing (Wales) Bill was introduced in the Senedd on 29 September 2025. The general principles were approved by 36 votes to 11 on 16 December 2025, and the ban could take effect between April 2027 and April 2030 — a timeline that would make Valley Stadium, the country's only licensed track, a thing of the past.
Scotland: The Greyhound Racing (Offences) (Scotland) Bill was introduced in the Scottish Parliament on 23 April 2025, with the Scottish Government expressing support for its general principles on 29 August 2025. Though Scotland has no active licensed tracks, the Bill would criminalise any future attempt to establish one — a symbolic and legal barrier that underlines the growing political opposition to the sport in the devolved nations.
These legislative developments sit alongside the sport's centenary celebrations, creating an unusual juxtaposition. GBGB argues that licensed racing provides the regulatory framework necessary to protect greyhound welfare — a position that rests on the data improvements documented above. It has also called on the UK Government to introduce a statutory levy on bookmakers, mirroring the arrangement in horseracing, to secure long-term welfare funding beyond the current voluntary 0.6% contribution. Opponents counter that no amount of regulation eliminates the inherent risks of competitive racing. Both positions are represented in the results data: the improving injury and rehoming statistics on one side, and the thousands of injuries and hundreds of racing-related deaths still occurring annually on the other. Where you land on that question depends on your assessment of acceptable risk — but the numbers themselves are not in dispute.
Results Archive
The value of greyhound results multiplies over time. A single race result is a snapshot — useful, but limited. A dog's last six runs give you a form line. Its last 20 runs, spanning multiple tracks, grades and distances, give you a profile. And the full archive — every race, every track, every season — gives you the dataset needed for genuine statistical analysis. Whether you are tracking a specific dog's career trajectory, assessing a trainer's seasonal patterns or looking at trap-bias trends at a particular venue over several years, the archive is where the real work gets done.
GBGB maintains the official database of results from all licensed racing in the UK. Third-party platforms, including Timeform, Racing Post Greyhounds and various bookmaker-affiliated results services, also provide searchable archives with different levels of depth and functionality. Some offer basic results — positions, times, SPs — while others include sectional data, racecard comments, weight records and running-line descriptions that add context to the raw numbers.
What to Look for in Archived Data
Historical results are most useful when you know what question you are trying to answer. If you want to know how a dog handles a specific distance at a specific track, you filter the archive for those parameters and read the relevant results in sequence. If you want to compare a trainer's strike rate across different venues, you pull trainer-level data and sort by track. The archive supports both casual browsing and structured research — but the latter will always yield more actionable insight.
Date-based searches are particularly useful around feature events. Pulling the archived results from a dog's Derby heat or semi-final, then cross-referencing with its subsequent graded form, tells you how Category One competition affected its performance and grading trajectory. Similarly, comparing seasonal trends — winter form versus summer form, for example — can reveal patterns that are invisible in a short-term form snapshot.
The archive is not just for bettors. Trainers, owners, breeders and welfare researchers all use historical results data for different purposes. For anyone involved in the sport at any level, the archive is the backbone of informed decision-making — and its depth and accessibility continue to improve as digital record-keeping becomes the standard across all 18 licensed venues.
Frequently Asked Questions
What do SP and BSP mean in greyhound results?
SP stands for Starting Price — the official odds recorded by the Starting Price Regulatory Commission at the moment the traps open. It is the price at which "SP bets" are settled and the standard benchmark in all published results. BSP stands for Betfair Starting Price, a separate figure calculated on the Betfair Exchange based on unmatched orders at the off. SP reflects the traditional bookmaker market; BSP reflects exchange-market opinion. The two often differ, and comparing them over time can reveal whether the bookmaker or exchange offered better value on a given dog. SP appears in virtually every results feed; BSP is available through Betfair and some third-party data services. For a deeper comparison of the two, see the SP and BSP section above.
How are greyhound races graded in the UK?
UK greyhound races are graded on an A-grade ladder running from A1 (the highest standard of graded racing) down to A10 or A11 at some tracks. A dog's grade is determined by its recent race times at a specific venue. Winning typically promotes a dog by one or two grades; finishing outside the top three may result in a demotion. Each track sets its own grading bands, so an A3 at one venue may not match the competitive standard of an A3 at another. Above the graded system sit open races and category stakes, which are unrestricted by grade and represent the elite tier of competition. Understanding the grade of a race is essential when interpreting results — a win in a lower grade against weaker opponents carries less analytical weight than a strong placing in a higher-grade contest. The full grading breakdown is covered in the grading section above.
How often do favourites win in UK greyhound racing?
In 2024, market favourites won approximately 35.67% of all graded greyhound races across UK licensed tracks, according to data compiled by OLBG. The rate varies significantly by venue — from as low as 31.60% at Kinsley to as high as 42% at The Valley. The second and third favourites combined account for a further 33–38%, meaning the top three in the market win roughly 71–74% of all races. These figures are useful as a baseline but should always be read alongside track-specific data, race grade and trap draw. Favourites win more reliably in higher-grade races and at venues with wider, less congested bends, where form tends to hold up more consistently.